Master Public Speaking (Even If You're Terrified of It)
Dr. Alexander McWilliam


From Gamer to Web3 Disruptor: How Amos Whitewolf Is Rebuilding Gamer Trust with PerionXP
Amos Whitewolf


From 0 to $25M ARR Bootstrapped: Adam Robinson’s Blueprint for SaaS Growth Without Funding
Adam Robinson


How to Scale as a CEO – Mindset, Strategy & Leadership Shifts, with Joe Leech, CEO Coach
Joe Leech


From Corporate Lawyer to Social Impact Entrepreneur: Sanjay Lobo's Journey with OnHand
Sanjay Lobo


From Premier League Star to Wellness Entrepreneur: Thomas Robson-Kanu's Journey with The Turmeric Co
Thomas Robson-Kanu

Master Public Speaking (Even If You're Terrified of It)
Dr. Alexander McWilliam
From Gamer to Web3 Disruptor: How Amos Whitewolf Is Rebuilding Gamer Trust with PerionXP
Amos Whitewolf
From 0 to $25M ARR Bootstrapped: Adam Robinson’s Blueprint for SaaS Growth Without Funding
Adam Robinson
How to Scale as a CEO – Mindset, Strategy & Leadership Shifts, with Joe Leech, CEO Coach
Joe Leech
From Corporate Lawyer to Social Impact Entrepreneur: Sanjay Lobo's Journey with OnHand
Sanjay Lobo
From Premier League Star to Wellness Entrepreneur: Thomas Robson-Kanu's Journey with The Turmeric Co
Thomas Robson-Kanu
Design
8 min read
A Practical Example of How to Measure the Impact of Design
A common challenge for designers, founders, and product leads is how to measure the impact of the design work you’re doing for your product. Connecting the dots between design and business outcomes proves to be overwhelming and often is considered too difficult or impossible. The reason? Design comes as an afterthought in the product development or growth experimentation process, and the tracked variables or KPIs can’t be attributed to the specific design deliverables.
Sit back and relax. This is fixable and, with the right process, the impact of design can be analysed relatively easy. What you need is:
A) a process
B) to start tracking before you start designing
We prepared this step-by-step guide for everyone interested in determining the value of the UX and design work they’ve recently done or commissioned (yes, this is not just for designers!).
Let’s choose an imaginary project: we need to increase the number of bookings a user makes for an on-demand dog walking app.
1. Define the Business KPI
Start with defining the main business objective for this project. In our case, it’s clear: increase the number of bookings per user. If you can’t define what the value for the business will be, then the project is probably not worth pursuing anyway.
The biggest mistake many people make at this stage is deciding that the design impact will be measured by the % the bookings have increased within a given timeframe, after the changes have been implemented. Wrong. You still don’t have a clear correlation between Design/UX and business growth. There might be hundreds of other factors that might influence the booking rate per user during the same period of time that has nothing to do with design (season, marketing activities, local events, etc.).
2. Identify the factors influencing the user behaviour which impacts the tracked KPI
Here’s where an experienced growth designer and a team of analysts and growth experts make all the difference. Going through the qualitative research and quantitative data, you have to identify the main triggers (usually common patterns) that make the user book more walks. Of course, we’re mainly concerned about the ones that are product-related, not external factors. Potential findings could be:
- When they can take advantage of a bulk offer
- When reading positive reviews by other users
- Knowing when their dog’s best friend is having a walk
- When they get a reminder about an upcoming busy period
- When the walker submits a walk report
To identify the above, you need to have a good understanding of the company analytical tools and ideally work with the broader team (BI, support, marketing). Some of the findings will be based on data; others will come from user interviews or your user empathy skills. You don’t need to be an expert in data analysis, but you need to have analytical thinking and making sure you’re drawing the correct conclusions from the data and the reports you have available (or work with someone who can do this for you).
3. Break it down into measurable design mini-projects
Here’s where the design process should take the “growth thinking” approach. To track the impact of the design work, you have to break all changes you’re about to apply into small, measurable design projects. Don’t get alarmed; this is still one project, and you don’t need to design them one by one or in a specific order. The flow of work should be whatever works for the team.
What you need to do is find a way to isolate the results for each design change and document the progress in a way that will be understood by everyone on the team. Let’s take the first two hypotheses as an example.
Example 1: When they can take advantage of a bulk offer
You have identified that offering a bulk offer (let’s say book 5, pay 4 walks) is increasing the number of bookings. From a design and UX point of view, your job is to find a way to guide the user to book this offer more frequently. This could be an upsell/add-on on the booking page or a new homepage section.
Documenting this could look something like an A/B test or a growth experiment document:
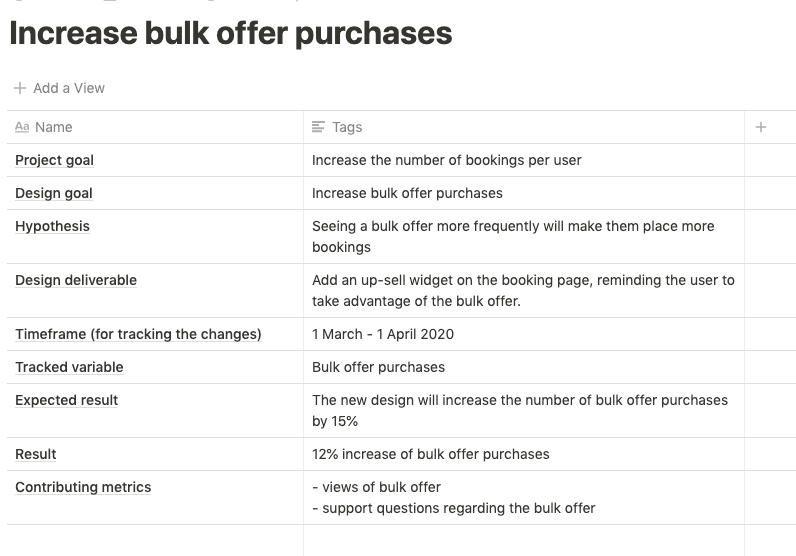
Example 1 – documenting the impact of design projects
Important to remember: Tracking the changes should always be with an isolated group of users (similar to a standard A/B test) or in a time period when no other design changes have been applied.
Example 2: When reading positive reviews by other users
In this case, the design challenge is how to increase the number of times users view customer reviews and the time spent on reading positive reviews.
Our document could look something like this:
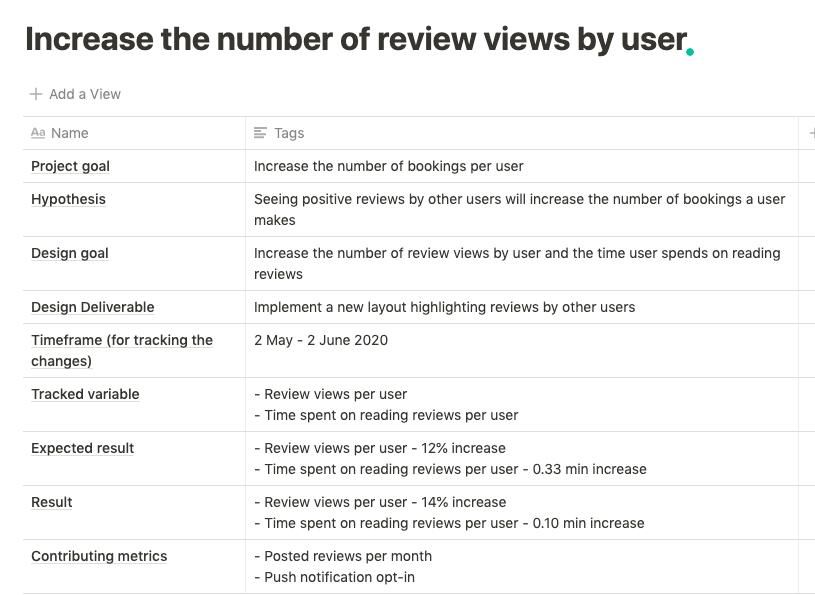
Example 2 – documenting the impact of design projects
4. Map the results from the design deliverables onto the business KPIs from point 1.
Some design changes will have direct, easy to track impact on the main business KPI. In Example 1 above, it’s clear that if people are buying more bulk offers, they’re booking more walks.
However, other design changes are focused on impacting the trigger that has proven to impact the KPI, like what we did in Example 2. It’s still trackable, but, in some cases, it might need to be over a longer period of time: the design changes you applied to increase the views of reviews might have been successful, the user is seeing more reviews, but how much this is impacting the number of bookings is still to be determined. If the analysis in Step 2 was correct, you don’t need to worry about it; it will surely impact the number of bookings, but mistakes happen, as we’re more often working with hypothesis than facts, so it’s always good to come back and review the results in a couple of months. In the context of design, this is still a successful change, as you have managed to increase the number of views of review and the time the user is spending on reading the reviews, but what is the business outcome?
To determine this, you need to create a funnel, similar to this:
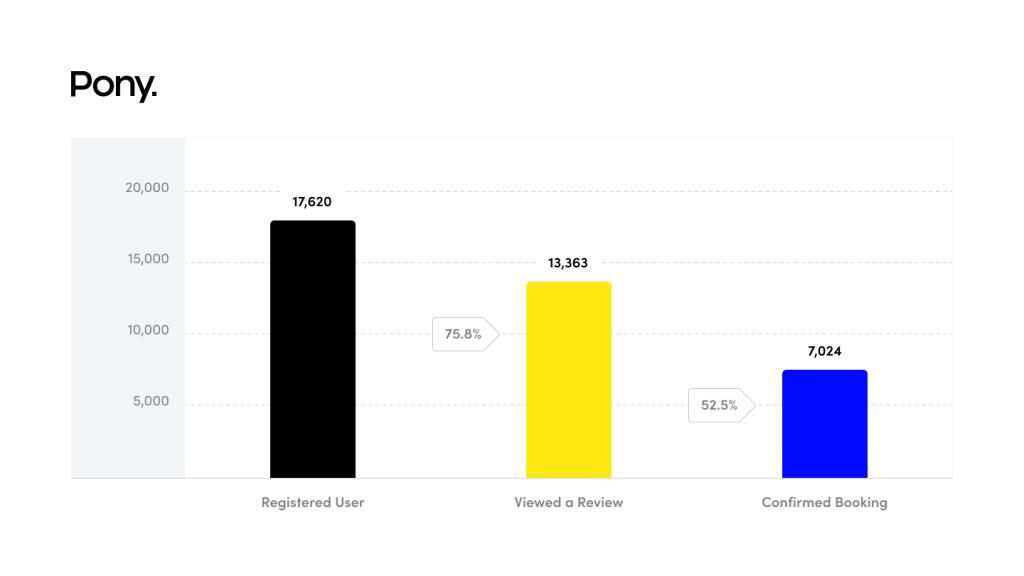
Graph: Design experiment funnel
The funnel is tracking the percentage of registered users who read a review and completed a booking. Your aim is to increase the percentage of users who booked a walk after they read a review.
Using the above example, you can successfully track how design impacts business outcomes for all projects. The templates and the process could differ from project to project, but the principle is the same: determine the business KPI, identify the design changes that will impact this metric, then isolate and document all design changes, track the results, and map them onto the main business KPI. Job done!
If you found this article useful, follow us on Instagram for even more practical and actionable design and growth tips and insights.
👇